Description
Electrotek PQVIEW
Electrotek PQView® is a software that expands the capabilities of Dranetz Encore Series and/or manage multiple monitoring systems. Developed by Electrotek Concepts, PQView is a database software application designed to store and analyze large quantities of power quality-related disturbance and steady-state measurement data from hundreds of monitoring points. Featuring data management tools that can quickly characterize this data, PQView includes statistical analysis and plotting tools that can provide single or multiple-site analysis of power systems. Encore Series, Signature System, PQNode family, Dranetz portable instruments, IEEE PQDIF, IEEE COMTRADE and many non Dranetz meters are PQView compatible.
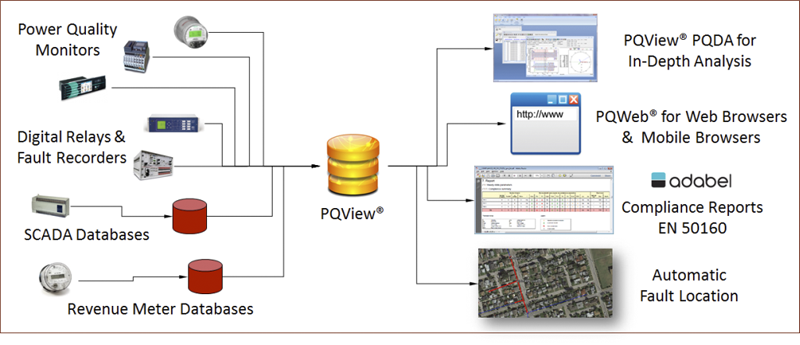
PQView® is a multi-component software system developed by Electrotek Concepts® and EPRI® for building and analyzing databases of power, power quality, and energy measurements, and available for use with Dranetz Encore instrument configurations. PQView integrates data from microprocessor relays, digital fault recorders, power quality monitors, smart meters, and SCADA historians into an open relational database.
PQView Fault Analysis Modules automatically combine electric power systems recordings with data from SCADA, GIS, and network topology to provide estimated fault location and to send an alarm to the operations personnel, reducing time to locate faults by hours.
- Reduce Time to Locate Faults
- Reduce Time to Classify Fault Types
- Reduce Fault Duration
PQView Report Writing Modules prepares industry standard reports or custom reports. These reports can automatically document compliance with local regulations and standards.
PQView Answer Modules® automatically assess the health and direction of capacitor switching, record reactive power changes, and the direction of voltage sags.
PQView combines powerful features in a user-friendly interface. Measurements can be stored in either Microsoft® Access or Microsoft SQL Server. A complete PQView system consists of three main applications: the Power Quality Data Manager (PQDM), the Power Quality Data Analyzer (PQDA), and PQWeb®.
Find out more at www.pqview.com
Features
PQ Data Manager (PQDM)
PQDM automatically builds power quality databases from data sources. It also automatically sends email notifications using SMTP servers or Microsoft Outlook clients when data sources have finished importing, rms voltage variations are imported from data sources, or measurements are not collected from a monitoring instrument for a specified period. PQDM automatically correlates measurements by time stamp and location. It also deletes old measurements, manually adds missed rms voltage, and performs EN 50160 or NVE 1557compliance calculations, automatic derivations, and automatic fault location. In addition, it can update measurement databases automatically once per day, manually, or as fast as once every minute.
PQ Data Analyzer (PQDA)
Steady-State Data Log Analysis
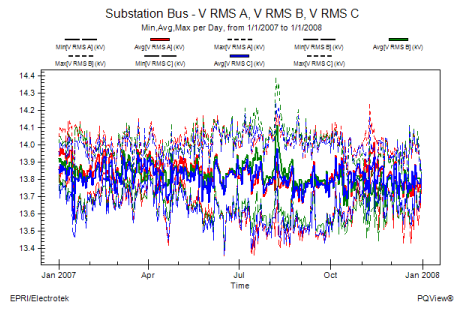
PQView creates trends, histograms, and statistical summary tables of more than 125 steady-state characteristics listed within the IEEE Std 1159.3-2003 PQDIF standard. It scores charts, event lists, tables, and indices to analyze voltage sags/dips, swells, and interruptions. PQDA interfaces with Microsoft Word to create summary documents automatically, and allows the user to filter invalid measurements from final analysis.
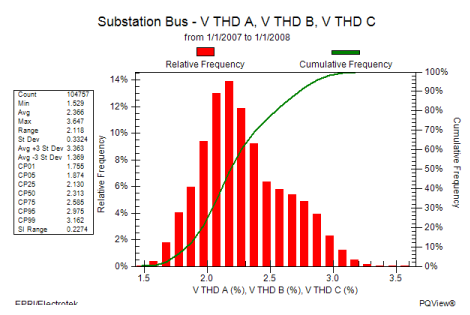
PQView’s trends and histograms can be copied automatically into Microsoft Word documents, exported to HTML documents with related graphics files, or sent to a printer. PQDA creates trends, histograms, profiles, and statistics for any steady-state voltage, current, power, and energy quantity. The data for trend and histogram charts can be filtered to exclude invalid measurements. Each trend can become an event timeline by plotting any associated waveform or rms variation measurements as tick marks along the x-axis.
Users can view trends and histograms for the minimum, average, maximum, standard deviation, count, and any percentile for steady-state data in intervals of minutes, hours, days, weeks, months, and years.
Measurements can be normalized to one of two nominal base voltages: the base voltage set when the event was triggered, or a base voltage set for the monitoring site. Derivations from waveform samples include interactive phasor charts, spectrum charts from one- to twelve-cycle FFT and DFT transformations, filtered charts, positive-, negative-, and zero-sequence components, voltage transformations through one to four transformer connections, and IEEE P1409 missing voltage. PQDA can quickly build event lists from the millions of events recorded in a measurement database. PQView “measurement events” consist of the waveform and rms samples recorded during voltage sags and swells due to faults and motor starting, and voltage transients due to fuse operations, lightning strikes, load switching, and capacitor and cable energizing. The event lists can be built based on simple queries that only select certain meters for a specific date range. Or, they can be more sophisticated, searching for single-phase sags, three-phase sags, single-phase faults, and three-phase faults.
RMS Voltage Variation Analysis
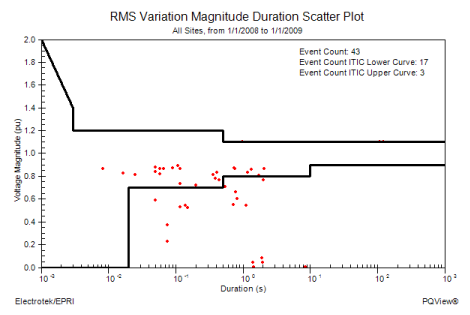
PQView can build ITIC Charts, CBEMA Charts, and SEMI F47 Charts, and custom charts that overlay multiple curves. Measurements from each meter can be plotted optionally in a different color. Because PQDA’s rms variation analysis algorithm involves temporal aggregation of multiple events occurring in close in time, users see the event that resulted in a particular voltage magnitude and duration, and any other events that occurred around the same time at that location.
PQWeb®
Internet Accessibility via PQWeb: PQWeb can provide data and reports via the Internet or company intranet. Through PQWeb, also available from Electrotek Concepts, a server runs PQView data analysis tasks and allows you to access and view the results using any web browser. With this software, PQView becomes a multi-platform application, able to work across otherwise incompatible operating systems.
Specialized Functionality
Radial and network fault location
Compliance with international and national power quality standards including EuroNorm EN 50160, the Colombian Energy and Gas Regulatory Commission (CREG 024), and the Norwegian Water Resources and Energy Directorate (NVE 1557)
- Voltage sag and interruption contract management
- Power quality event log correlation with SCADA operation logs
- Load forecasting
- Wind generation feasibility and assessment
For use with Dranetz Encore Series instrument configurations:
PQView® is enterprise software available to expand the analytical capabilities of Dranetz Encore Series and/or manage multiple monitoring systems. Developed by Electrotek Concepts, PQView® is a database software application designed to store and analyze large quantities of power quality-related disturbance and steady-state measurement data from hundreds of monitoring points. Featuring data management tools that can quickly characterize this data, PQView includes statistical analysis and plotting tools that can provide single- or multiple-site analysis for power systems. Encore Series, Signature System, PQNode family, Dranetz portable instruments, IEEE PQDIF, IEEE COMTRADE and many non Dranetz meters are PQView compatible.
